

When I teach financial modeling during in-person seminars, I love starting the class with a classic interview riddle:
“If you were marooned on a desert island and could only bring TWO financial statements to evaluate a company’s financial health, which two would you pick—and why?”
To answer that question correctly, you have to understand the most dynamic, honest document in corporate finance: The Statement of Cash Flows.
The Links Between the Financial Statements
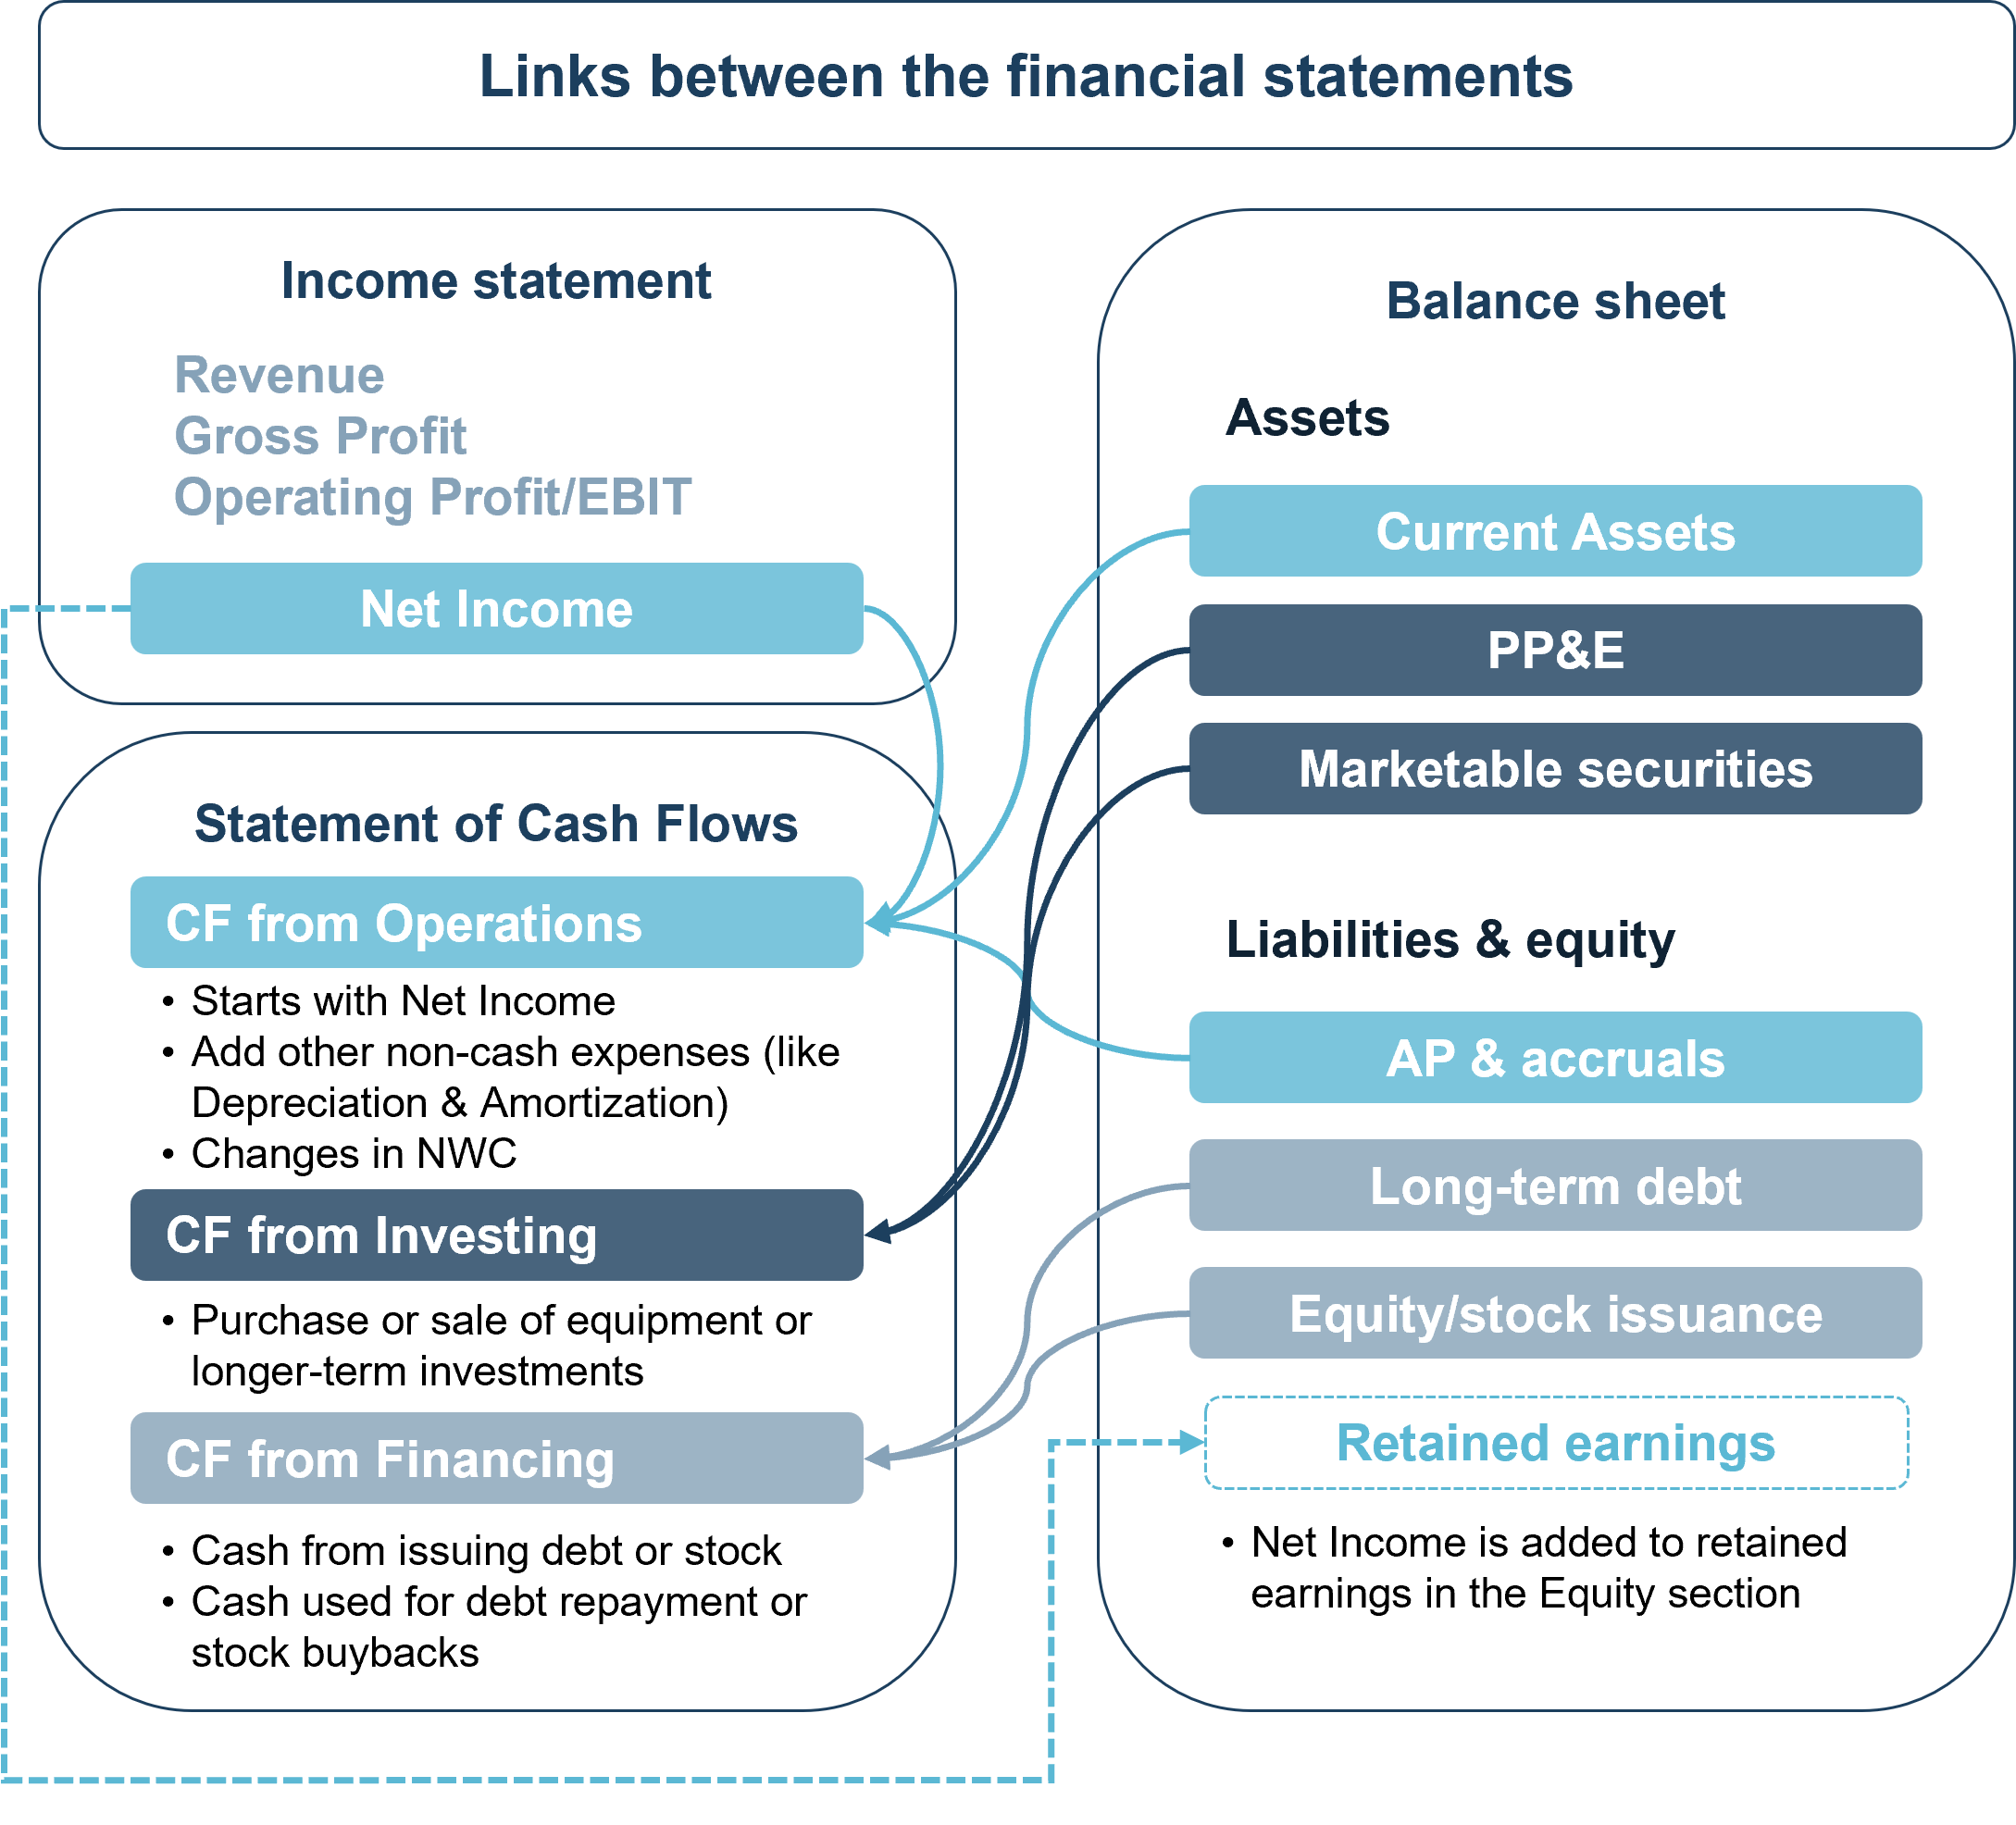
While the Income Statement measures accrual profitability over a period and the Balance Sheet provides a cumulative snapshot of assets and liabilities, the Statement of Cash Flows acts as the vital bridge between them. It strips away accounting conventions and answers the ultimate question for any operator or investor: Where did actual cash come from, and where did it go?
Deconstructing the Three Buckets of Cash Flow
Under GAAP accounting, every single dollar entering or exiting a company’s bank account must be categorized into one of three distinct buckets:
Cash Flow from Operations (CFO)
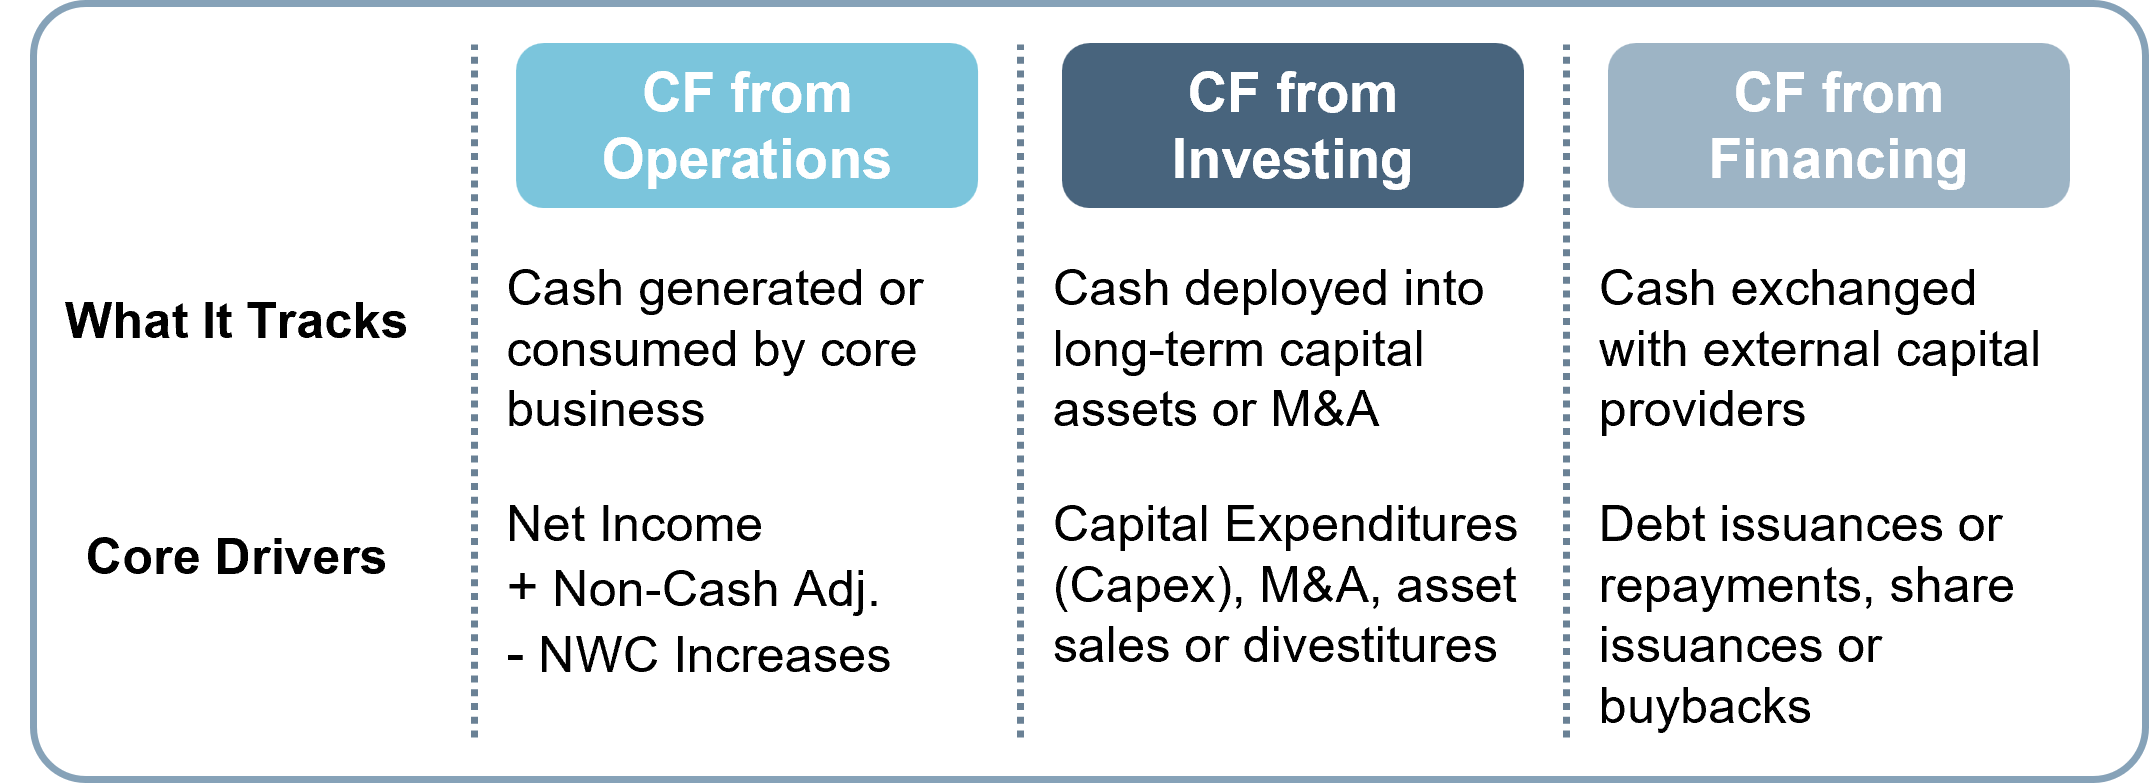
Cash Flow from Operations is the lifeblood of any business and shows us how well the business is doing without the influence of external capital. Cash Flow from Operations takes the accrual Net Income from the Income Statement and converts it back into cash by adjusting for non-cash expenses (like Depreciation & Amortization) and changes in Net Working Capital (ΔNWC). If a company’s CFO is consistently negative while its P&L reports high Net Income, the business is suffering from severe cash collection or inventory accumulation issues.
Cash Flow from Investing (CFI)
CFI reflects long-term capital allocation choices. The primary line item here is Capital Expenditures (Capex), which is cash spent purchasing Property, Plant & Equipment (PP&E) to sustain or grow the business. CFI also records cash spent on M&A acquisitions, cash used to buy longer-term marketable securities (> 3 months), or cash gained from selling off long-term physical assets.
Cash Flow from Financing (CFF)
CFF tracks interactions with the capital markets and how the business is raising capital from external sources. When a company issues new corporate bonds, takes on new bank loan, or raises cash by selling additional shares, it is recorded in CRI. On other hand, cash outflows in CFI include paying down the principal on outstanding debt, buying back shares, and cash dividend distributions to equity holders.
Why Cash Flows from Investing & Financing Are NOT Revenue
A common mistake made by new business owners and non-finance founders is assuming that any cash entering the bank account should be considered “revenue,” and I have seen situations where a small business takes on a PPP loan and tries to report the cash as “revenue” on the income statement.
Let’s look at an example: suppose a tech firm takes on a five million ($5M) credit facility and raises ten million ($10M) in venture equity. The company’s bank account balance jumps by $15 million. However, zero dollars of that cash inflow hit the Income Statement as Revenue. Why?
Revenue represents value created through core operations (exchanging goods or services with customers). So, because the $15M that hit the bank account is not from things that were sold to customers, that cash is instead recorded in Cash Flow from Financing (CFF). This $15M represents borrowed capital or sold equity ownership that carries future liabilities or dilution to existing shareholders.
Similarly, if a manufacturing firm sells an unused warehouse for $2 million, that cash inflow appears under Cash Flow from Investing (CFI). The $2M from the warehouse is a one-time asset liquidation, not a repeatable operating revenue stream.
The Golden Rule: Never confuse capital raised (Financing) or assets sold (Investing) with operational money from customers (Revenue).
How the Cash Flow Statement Is Derived from the Balance Sheet and Income Statement
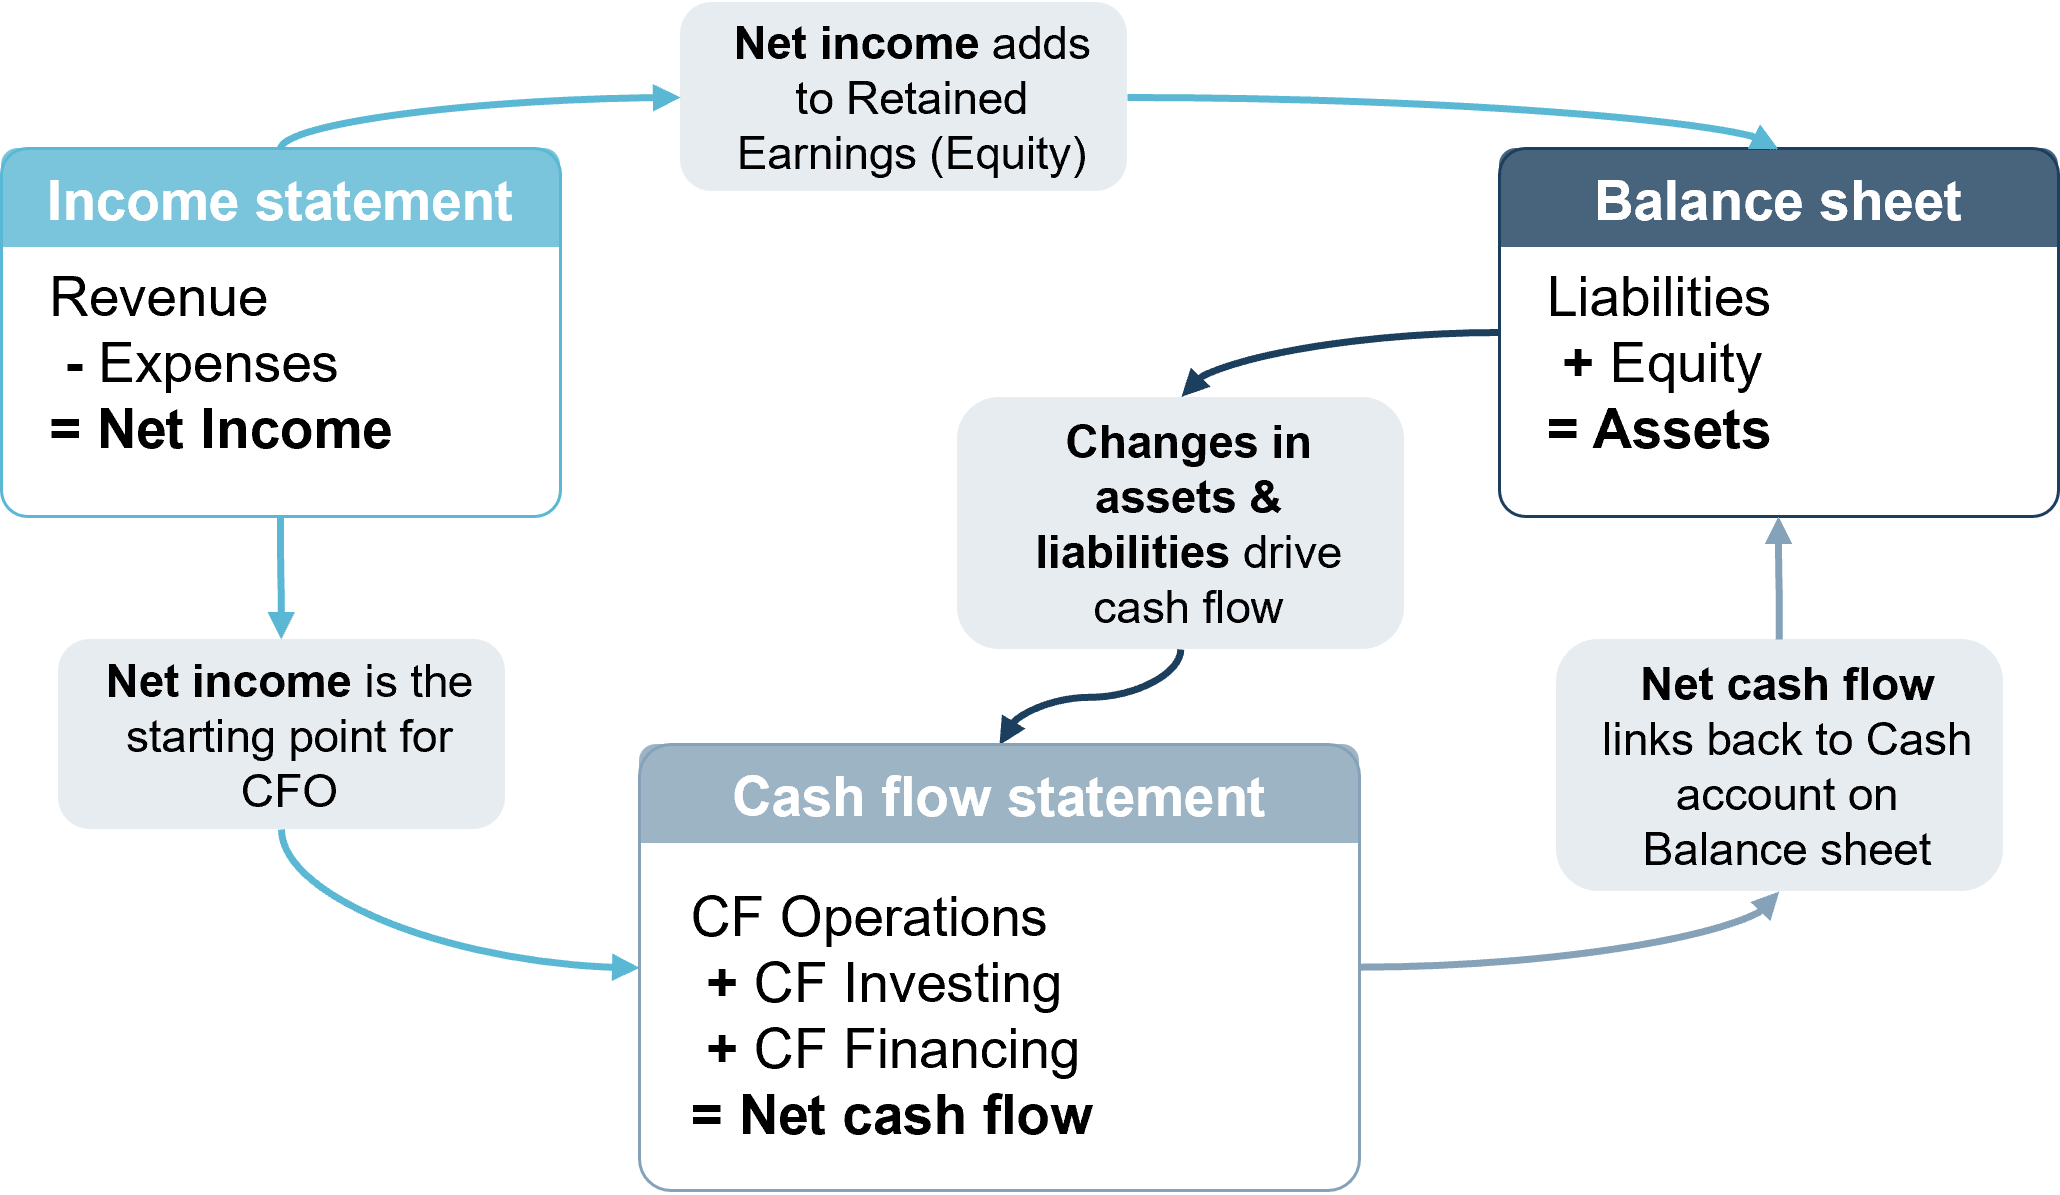
The Cash Flow Statement is derived directly from the Income Statement for the most recent year, say FY’25, and the changes between two consecutive Balance Sheets (for example, Balance Sheet from FY’24 and Balance Sheet from FY’25). When you sum the net totals across Cash from Operations, Investing, and Financing, you arrive at the Net Change in Cash:
ΔCash Total = CFO + CFI + CFF
Please note: the triangle symbol Δ is called “delta” means “changes in”.
Adding this ΔCash Total to the Beginning Cash Balance on the Balance Sheet yields the Ending Cash Balance—closing the financial loop. For each bucket of cash flow, we will looks at the appropriate parts of the Income Statement and Balance Sheets to derive what we need.
Deriving Cash Flow from Operations:
Cash Flow from Operations = Net Income + Non-Cash Expenses − ΔCurrent Assets + ΔCurrent Liabilities
For most businesses, Cash Flow from Operations will have to most moving parts of any of the cash flow buckets, so let’s consider a simple example below to show how calculating Cash Flow from Operations works in practice. For our simple business, we grow and sell apples. FY’24 first full year of operation.
On the Income statement, our Revenue is from selling apples to our customers. The COGS comes from the costs of growing the apples and the direct labor to farm the apples. The Opex (operating expenses) are the rent, utilities, admin salaries, and professional fees like paying our CPA. We have an apple picker for our PP&E and we depreciate the apple picker every year through the Depreciation & Amortization (D&A) line on the Income statement. Lastly, we pay income taxes and a small amount of interest on the loan we used to buy the apple picker, which brings us to our Net Income to start our CFO calculation.
On our Balance sheet:
In the Assets section, we have: the Current assets of Cash & cash equivalents represent cash in our bank account, Accounts receivable that come from customers who have received their apples, but have not yet paid their invoice, Inventory are the apples that have been picked and are waiting to be sold; then our Long-term assets from the purchase of our apple picker which is the PP&E (Property, Plant, & Equipment).
For the Liabilities section, we have: Current liabilities of Accounts payable that comes from the invoices that our business has received, but we have not paid yet, such as rent or utilities that are due; in Long-term liabilities, we took on some bank debt to buy our apple picker, so we have the outstanding balance from the Loan for the apple picker, assuming the loan has a 10 year term (so we pay the total principal over 10 years) and a 5% annual interest rate, which drives Interest expense on our Income statement.
Lastly, our Equity section includes the Retained Earnings that tracks the cumulative Net Income generated by the business. Since our business just started in FY’24, the opening value of Retained Earnings is set to zero. The business owners also injected $500 startup cash in FY’24 and added another $50 in FY’25 and they were issued stock in exchange, so we see the par value of Common stock and Additional paid-in capital associated with that equity issuance.
Below are the financials for the past two years of our apple business. Remember that the Income statement shows a cumulative “flow” of money, so we only need the data from the most recent year, FY’25. The Balance sheet is a single point in time “snapshot,” so we need two points in time to figure out the cash flow changes between FY’24 and FY’25. You can see below how we use the items from the Income statement and Balance sheet to calculate the Cash from Operations, Investing, and Financing for the apple business.

From the Income statement, we can see that the little apple business is growing and is profitable. The Accounts receivable, Inventory, and Accounts payable items on the Balance sheet are all growing too, which is normal. The business is generating positive cash from operations, which is great. When we look at our CFO calculation, we see that the increase in Accounts receivable and Inventory (Current assets) means that more cash is tied up in those assets, which is reducing our overall cash flow. This is where rapid revenue growth can get tricky. We may need to consider finding ways to get our customers to pay faster or asking for longer payment days with our vendors to hold on to our cash a little longer and make sure the business a bit more breathing room.
The Desert Island Answer Revealed
Now, let’s return to our opening riddle:
If you could only bring TWO financial statements to evaluate a company, which two would you pick?
The Answer: The Balance Sheet and the Income Statement.
The Rationale: If you have the Income Statement for a given period plus two consecutive Balance Sheets (the beginning and ending snapshots for that period), you can mathematically reconstruct the entire Statement of Cash Flows yourself!
Net Income comes from the Income Statement.
Non-cash depreciation is inferred from the change in accumulated depreciation.
Working Capital changes (ΔA/R, ΔInventory, ΔA/P) are calculated by subtracting the old Balance Sheet from the new one.
Capex and debt movements are derived from changes in PP&E and long-term liabilities.
What if you could only bring ONE statement?
If you were forced to choose just ONE statement, the answer flips: you take the Statement of Cash Flows (specifically Cash Flow from Operations). A company can survive for months or even years reporting negative Net Income, but as soon as the cash balance drops to zero, operations halt, payroll fails, and the firm enters insolvency.
🤖 AI Finance Lab: Reconstructing Cash Flows in 60 Seconds
Let’s put this statement reconciliation into practice using AI.
Exercise: Using your favorite model, upload the recent 10-K filing for Block, Inc. (SQ) or another business you’re interested in.
Try the following prompt to start analyzing and reconciling cash through the financials statements reported in the 10K:
“You are a corporate finance director analyzing cash flow. Navigate to the Consolidated Financial Statements in this 10-K. Extract: (1) Net Income from the Income Statement, (2) Depreciation & Amortization add-back from Operating Cash Flows, (3) Capital Expenditures from Investing Cash Flows, and (4) The Net Working Capital adjustments. Explain in 3 bullet points how management reconciled P&L Net Income to Net Cash Provided by Operating Activities.”
Key Takeaway for Readers
Net Income is an accounting opinion, but cash flow is a hard fact. Always remember: P&L shows profitability, the Balance Sheet shows solvency, but the Statement of Cash Flows shows liquidity and truth.
© Katherine Dextraze, F Avenue Consulting, 2026