

Have you ever tried to compare two completely different businesses side by side and felt like you were comparing apples to oranges?
Think about a global consumer brand relying on outsourced manufacturing, a tech pioneer pouring billions into custom hardware R&D, and a healthcare organization navigating strict regulatory frameworks. Each company operates in a different environment, with a distinct capital structure and supply chain model. On paper, their financial statements can feel like they are written in different languages.
So, how do we cut through those operational differences to see how well management is actually using its capital?
To get a clear, unified view, we look beyond basic profit margins to Return on Invested Capital (ROIC) and its forward-looking partner, Return on Incremental Invested Capital (ROIIC).

Understanding the Metrics: Historical ROIC vs. Incremental ROIC
Standard profit margins tell you how much revenue stays in the building after paying operational expenses. But ROIC measures how efficiently a company turns all the capital provided by credit investors and shareholders into operating profit.
Where “NOPAT” is the net operating profit after tax for the period (say, one year) and “Average Invested Capital” is the book value of total shareholders equity and total net debt, averaged over the same period.
What is “Invested Capital”?
Invested Capital is the net operating assets a business needs to function day-to-day or the total pool of funding provided by investors and lenders to buy those assets.
You can look at it from two intuitive angles on the balance sheet:
The Operating Angle: It is the Net Working Capital (current operating assets minus non-interest-bearing current liabilities like accounts payable) plus long-term operating assets like factories, equipment, software, and intangibles.
The Financing Angle: It is the total sum of Interest-Bearing Debt plus Shareholders’ Equity, minus any excess cash and cash equivalents sitting on the balance sheet.
Why Do We Use the “Average”?
NOPAT is a flow metric earned across an entire fiscal year, so using a single point-in-time balance sheet number from year-end can distort the calculation. We use Average Invested Capital, the average of the beginning and ending capital balances for the year, so that our denominator accurately aligns with the timeframe over which the profit was generated. Because ROIC compares NOPAT to total average invested capital, it gives us a capital-structure neutral view of economic profitability.
Incremental ROIC (ROIIC): Measuring Fresh Capital
Historical ROIC looks backward, it blends legacy investments made ten years ago with decisions made last quarter. To answer the key investor question “what have you done for me lately?”, we need look at Return on Incremental Invested Capital (ROIIC). ROIIC isolates the return earned specifically on the most recent dollars deployed into new growth projects, R&D, or facility expansions.
As Warren Buffett famously observed, the best business to own is one that can continuously reinvest large amounts of incremental capital at very high rates of return.
Choosing the Right Lens: Core Capital Metrics Compared
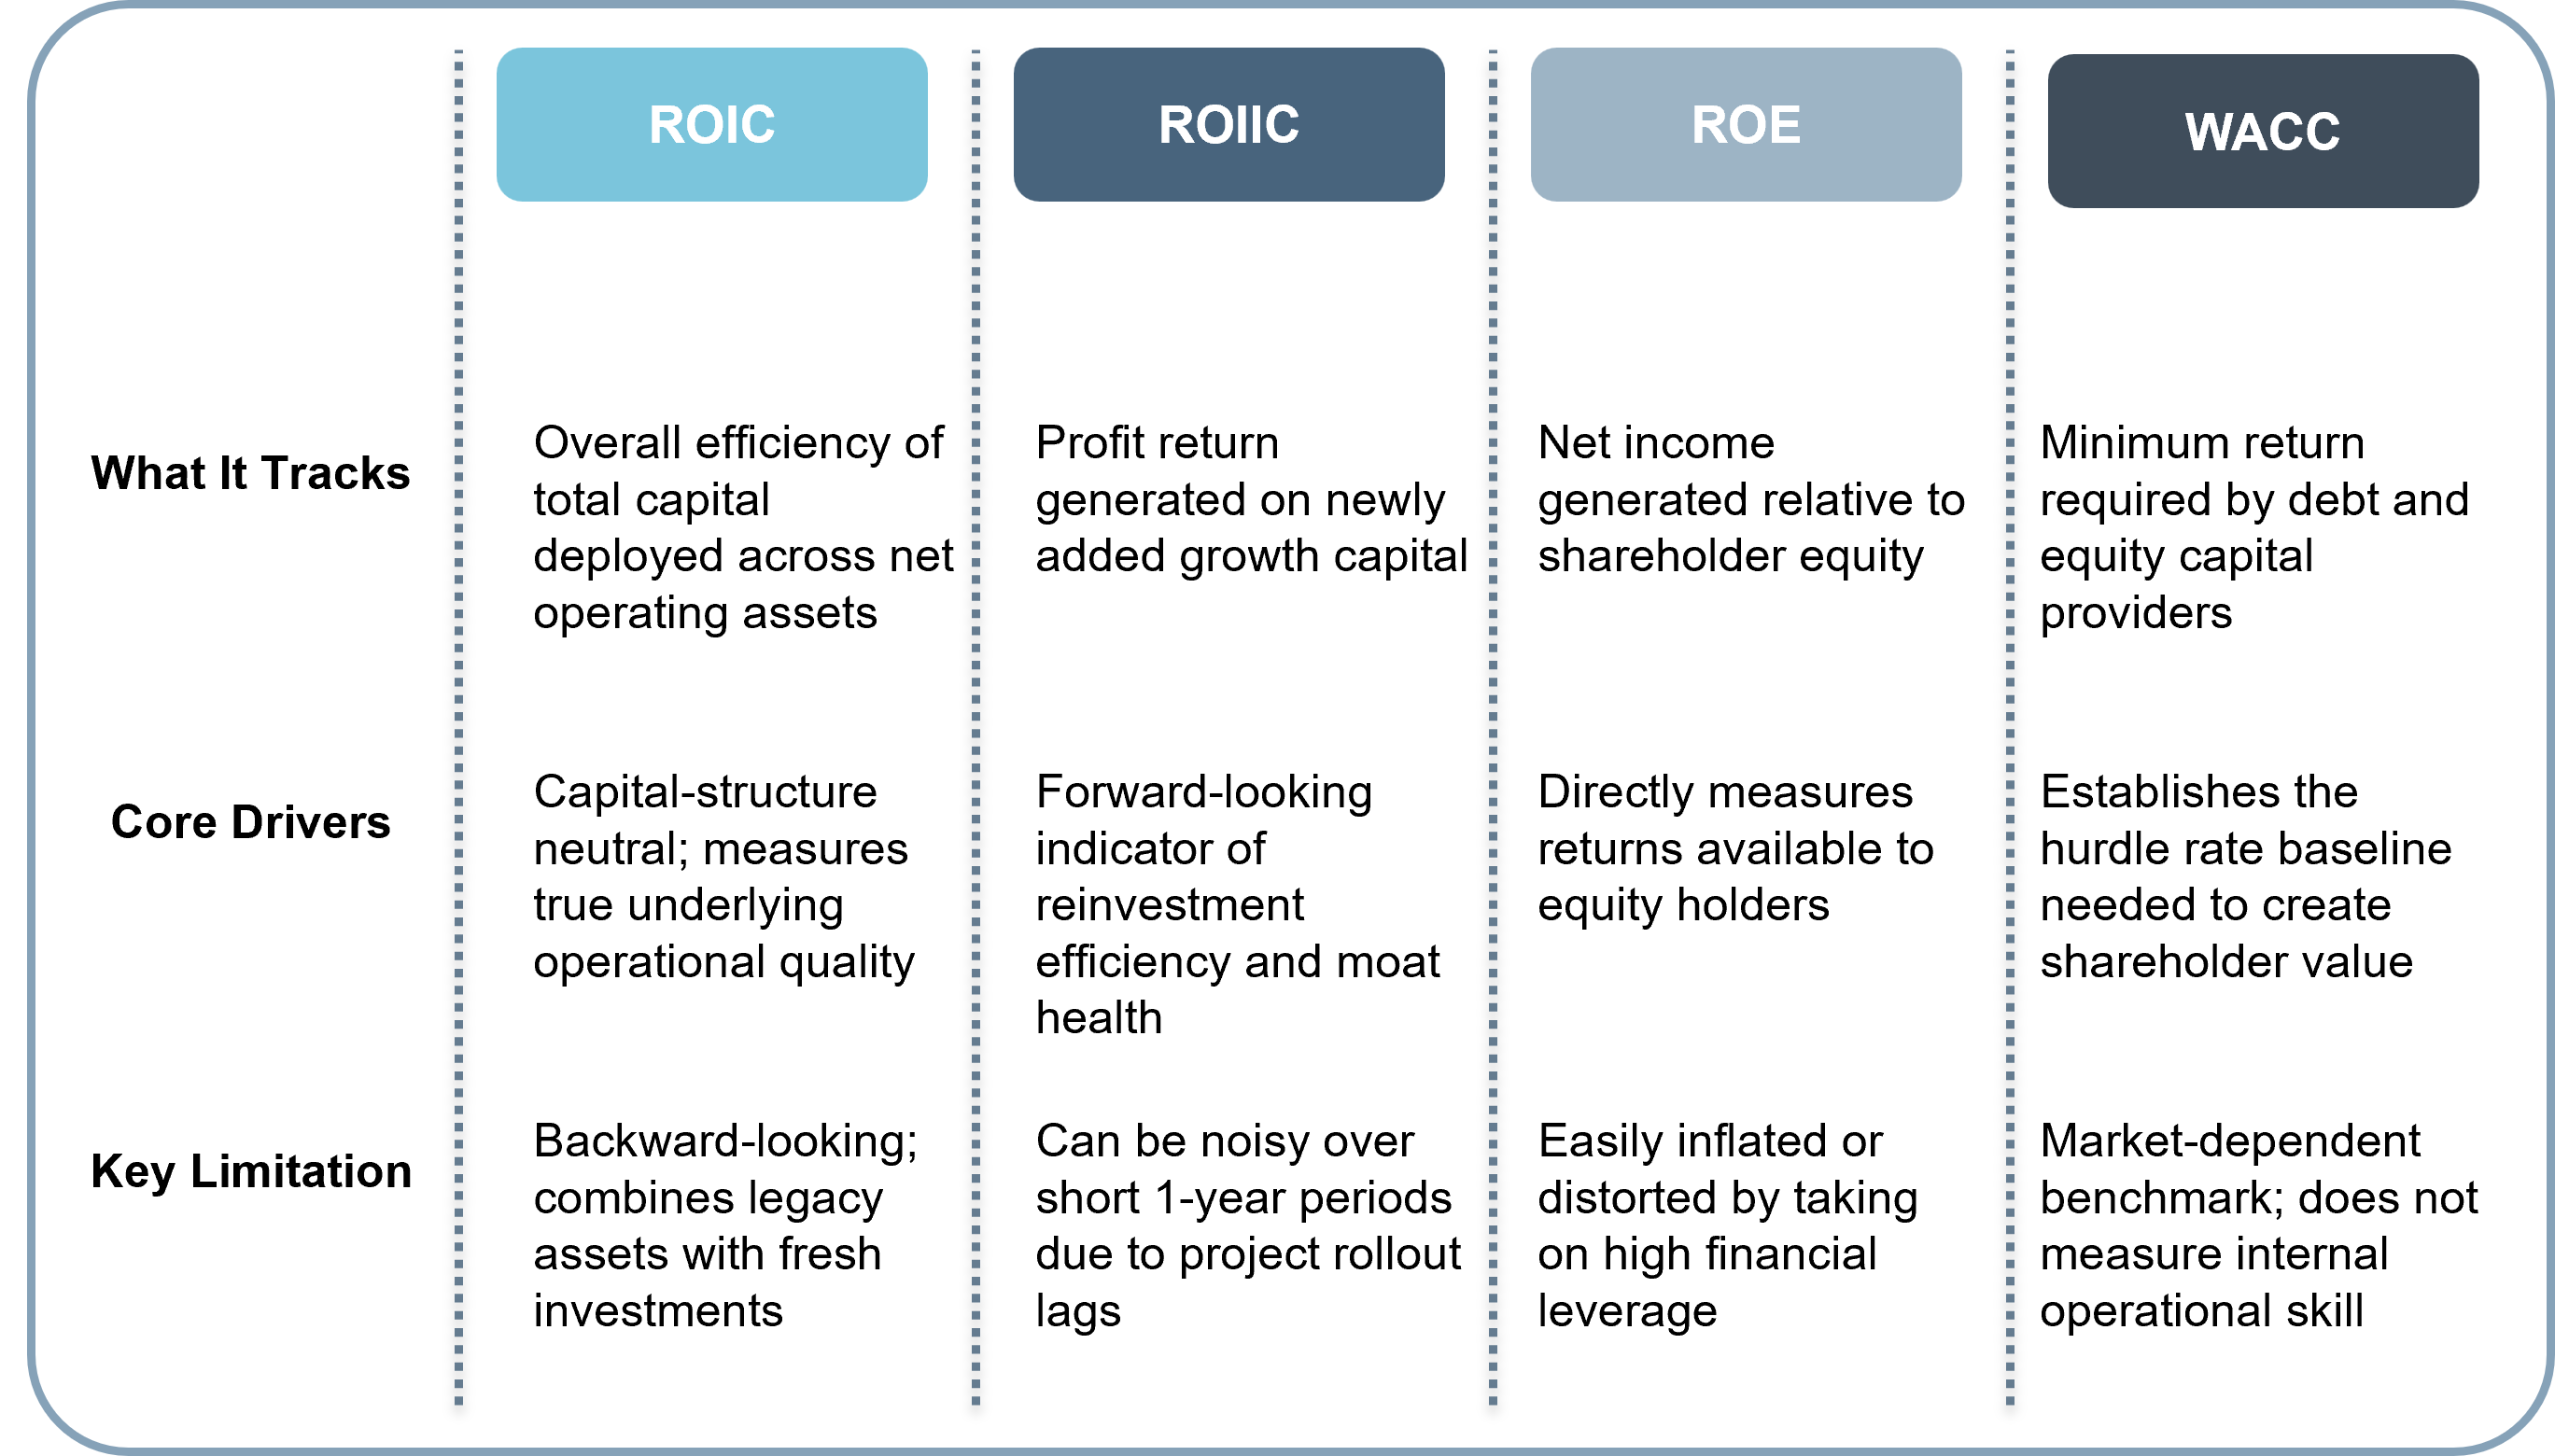
At this point, you might be wondering - But what about ROE (Return on Equity)? And how do we know a good ROIC when we see one?
A “good” ROIC need to comfortably exceeds the company’s Weighted Average Cost of Capital (WACC). When a business earns more on its invested capital than the cost to raise that capital, it creates true economic profit.
On the surface, ROE seems like the most direct metric for equity investors because it focuses strictly on net income relative to shareholders’ equity. However, ROE has a major blind spot: it can be easily inflated simply by taking on heavy debt. A company with a skyrocketing ROE might not be operating more efficiently at all—it might just be taking on financial leverage.
That is why we look across all four metrics together to get a more complete picture.
Real-World Proof: How These Metrics Play Out in Practice
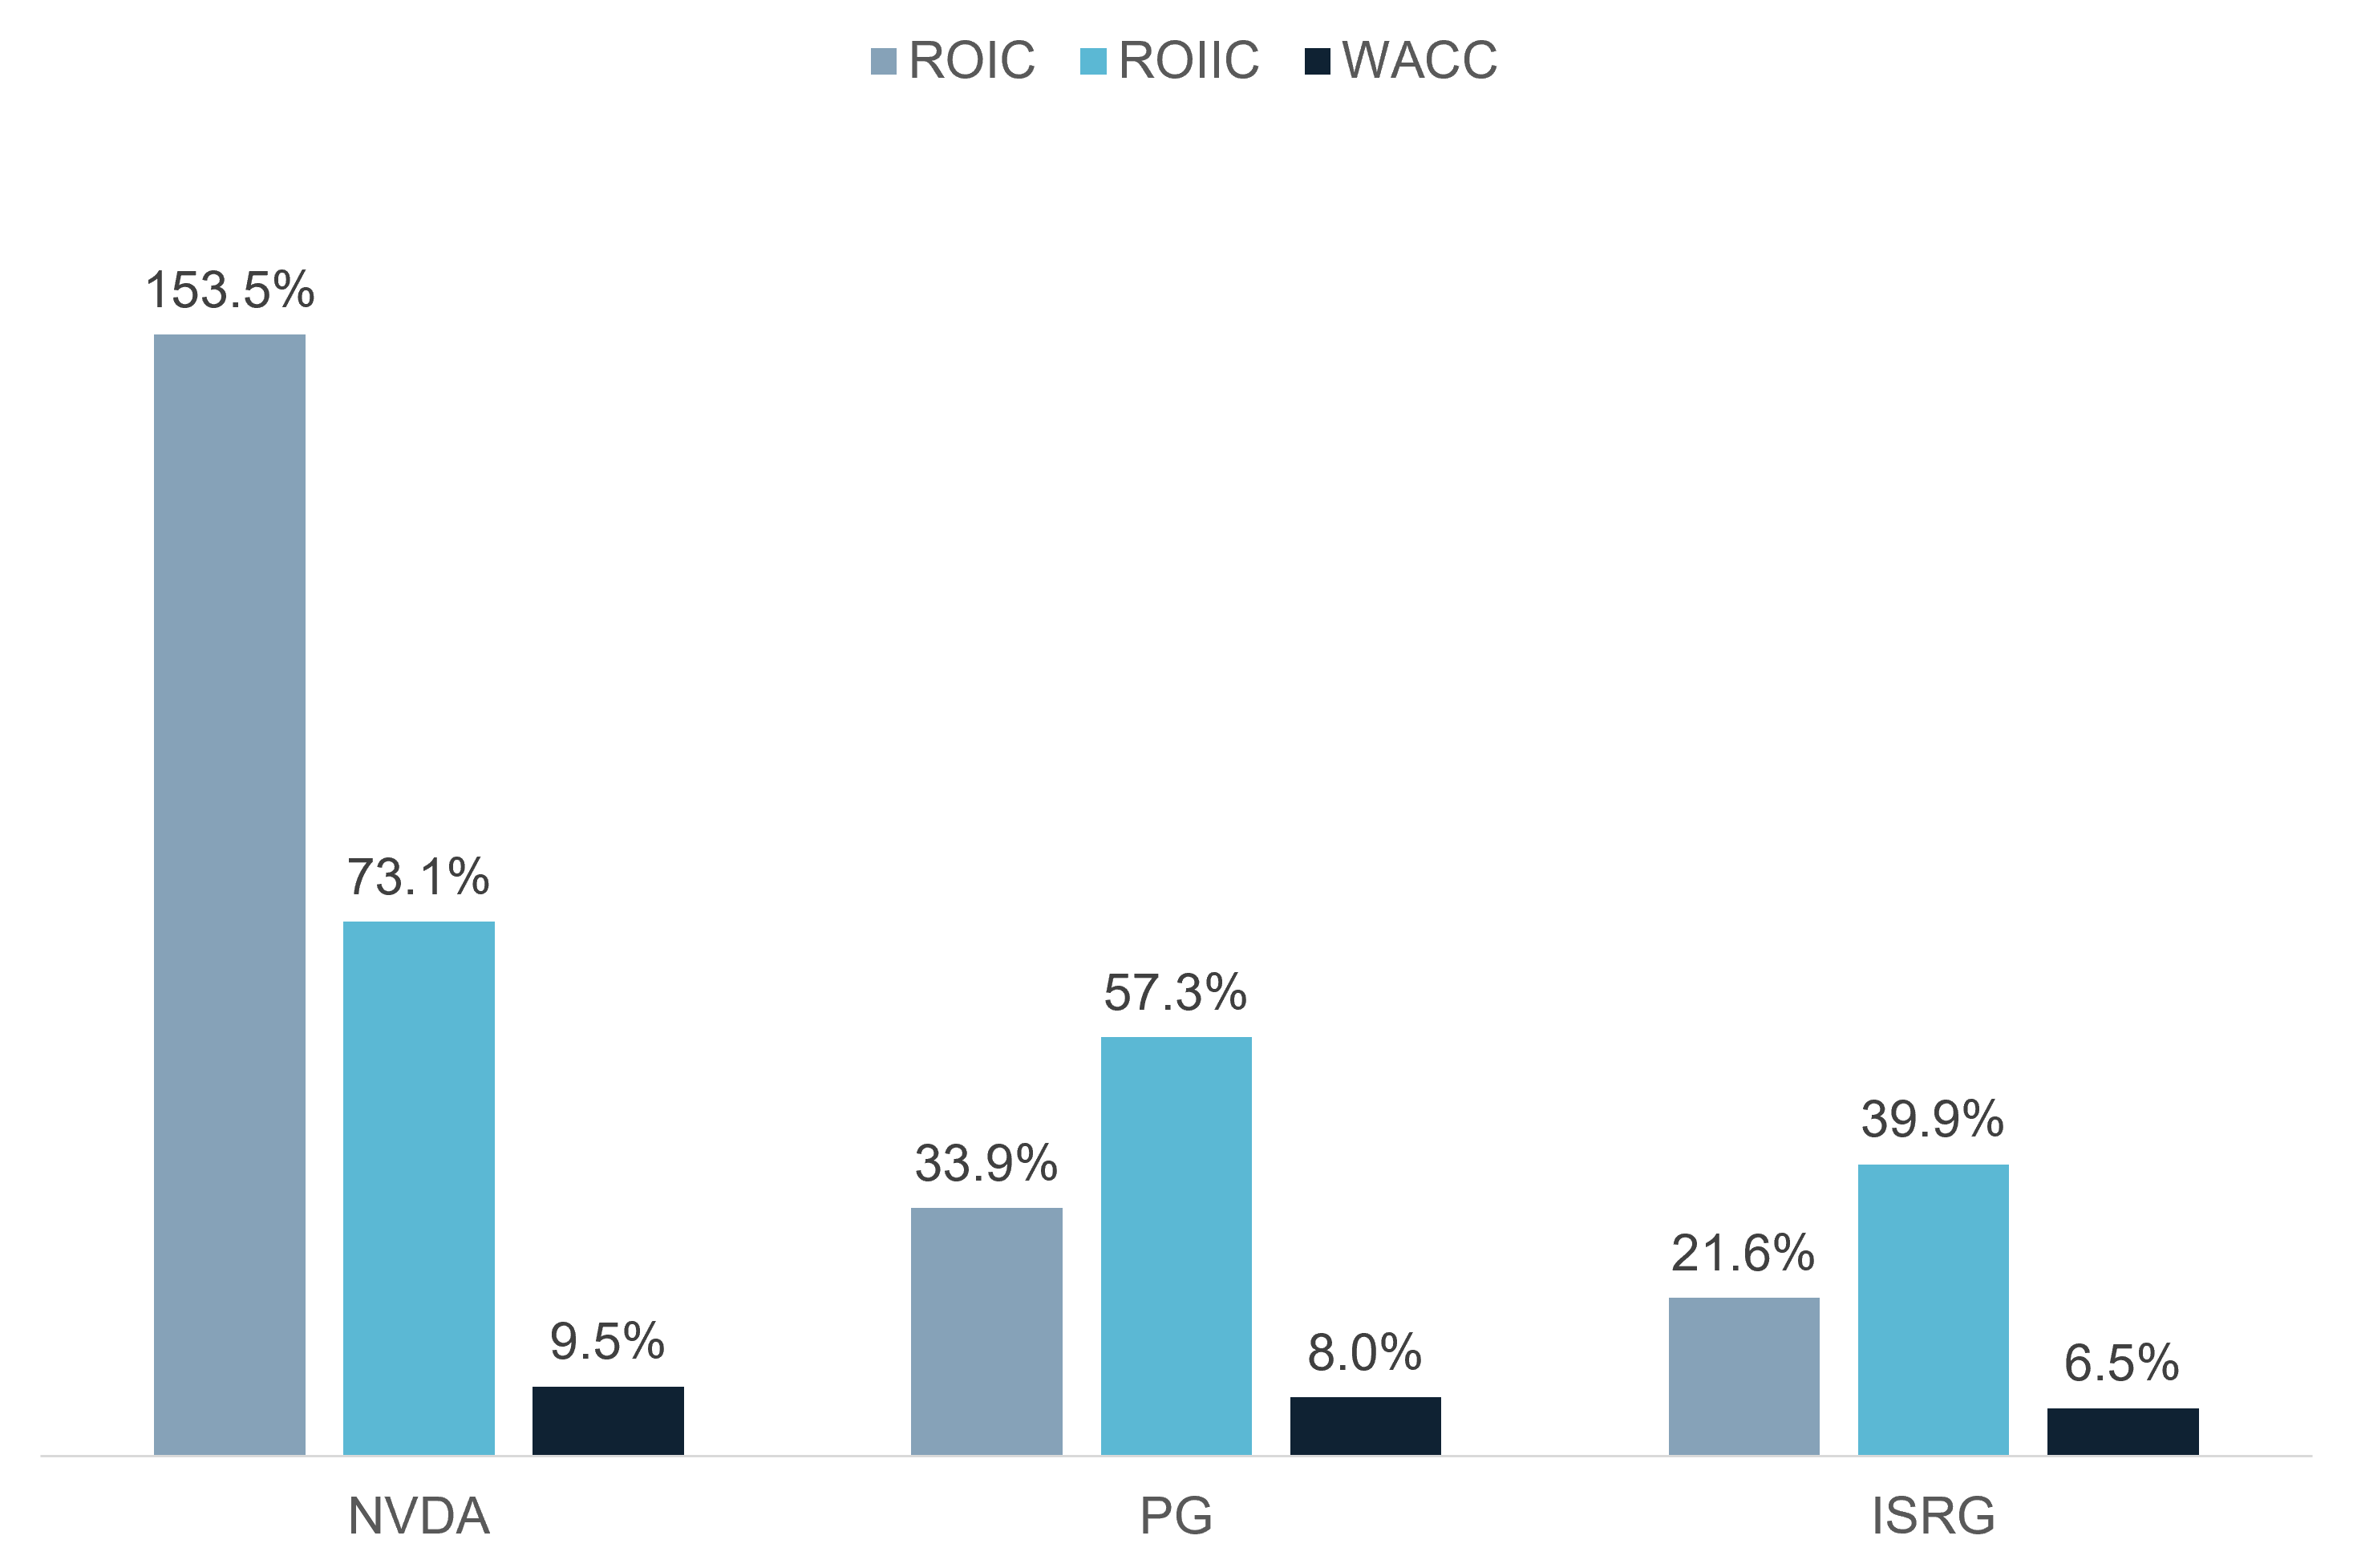
To see how capital efficiency transforms across industries, let’s look at the ROIC and ROIIC for for three distinct industry leaders: NVIDIA, Proctor & Gamble, and Intuitive Surgical. We’ll use the latest completed full fiscal year for each company.
1. NVIDIA NVDA 0.00%↑ (High-Growth Tech)
Step 1: Calculate NOPAT
FY2025 (Year ended Jan 26, 2025):
Operating Income (EBIT): $81,453M
Effective Tax Rate: 13.3%
FY2025 NOPAT = $81,453 * (1 - 13.3%) = $70,620M
FY2026 (Year ended Jan 25, 2026):
Operating Income (EBIT): $130,400M
Effective Tax Rate: ~13.0%
FY2026 NOPAT = 130,400 * (1 - 13.0%) = $113,448M
Change in NOPAT (ΔNOPAT): $113,448 - $70,620 = $42,828M
Step 2: Calculate Invested Capital (Total Debt + Total Shareholders’ Equity – Cash & Short-Term Investments)
FY2025 Balance Sheet (Jan 26, 2025):
Total Debt: $8,463M
Shareholders’ Equity: $79,363M
Less: Cash & Short-Term Investments: $43,210M
FY2025 Invested Capital = $8,463 + $79,363 - $43,210 = $44,616M
FY2026 Balance Sheet (Jan 25, 2026):
Total Debt: $8,500M
Shareholders’ Equity: $157,300M
Less: Cash & Short-Term Investments: $62,556M
FY2026 Invested Capital = $8,500 + $157,300 - $62,556 = $103,244M
Average Invested Capital (FY2026): ($44,616 + $103,244) / 2 = $73,930M
Change in Invested Capital (ΔInvested Capital): $103,244 - $44,616 = $58,628M
Step 3: Calculate the Return Metrics
Historical ROIC (FY2026):
\(\text{ROIC} = \frac{\text{FY2026 NOPAT}}{\text{Average Invested Capital}} = \frac{\$113,448\text{M}}{\$73,930\text{M}} = \mathbf{153.5\%}\)Incremental ROIC (ROIIC, FY2025-FY2026):
The Strategic Takeaway: Why can NVIDIA generate a 73% return on tens of billions of fresh capital? It comes down to two core strategic advantages:
The Fabless, Asset-Light Hardware Model: NVIDIA doesn’t build multi-billion-dollar silicon fabrication plants itself; it outsources heavy manufacturing to foundry partners like TSMC. This keeps its physical capital requirements relatively light compared to its revenue scale.
The Software Ecosystem Moat (CUDA): NVIDIA isn’t just selling chips—it sells a unified hardware and software platform. Developers built the entire modern AI stack on CUDA over two decades, creating massive switching costs and strong pricing power (gross margins above 70%).
When demand for AI infrastructure exploded, NVIDIA didn’t need to rebuild its asset base from scratch. It poured capital into R&D and supply commitments, and because its software moat protected its margins, nearly every new dollar of sales converted directly into operating profit (NOPAT). ecause fresh capital yields a 73.1% ROIIC against a ~9.5% cost of capital, new AI R&D investments generate extraordinary economic profit.
2. Proctor & Gamble PG 0.00%↑ (Consumer Staples)
FY2024 (Period ended June 30, 2024): $18.5B Operating Income * (1 - 20.3%) = $14.78B NOPAT and $73.5B Invested Capital
FY2025 (Period ended June 30, 2025): $20.5B Operating Income * (1 - 20.4%) = $16.3B NOPAT and $77.3B Avg Invested Capital
Calculated Metrics: 21.6% Historical Average ROIC and 39.9% 1-Year ROIIC
Strategic Takeaway: Mature consumer staples typically carry a low WACC (~6.5%) due to stable, defensive cash flows [16]. P&G’s 39.9% ROIIC demonstrates superior brand equity and reinvestment discipline: by directing capital toward premium product extensions (Tide Pods, Oral-B iO) and supply chain automation, management generates incremental returns 6x higher than its cost of capital.
3. Intuitive Surgical ISRG 0.00%↑ (Medical Robotics)
FY2024 (Period ended Dec 2024): $2.35B Operating Income * (1 - 16.0%) = $1.97B NOPAT and $6.86B Avg Invested Capital
FY2025 (Period ended Dec 2025): $2.95B Operating Income * (1 - 16.0%) = $2.48B NOPAT and $7.74B Avg Invested Capital
Calculated Metrics: 33.9% Historical Average ROIC and 57.3% 1-Year ROIIC
Strategic Takeaway: ISRG runs a classic zero-debt "razor-and-blades" business model. Selling each da Vinci robotic system locks in high-margin recurring revenue from specialized instruments, accessories, and software services. Because incremental capital generates a 57.3% ROIIC against an ~8.0% WACC, expanding its installed system base accelerates reinvestment returns at more than 7x its hurdle rate.
☕ Try this at home:
When you evaluate a company or plan your team’s budget, do you focus more on historical returns or the expected return on your next dollar spent?
If you’d like to test this framework on companies in your own portfolio or watchlist, try copying and pasting this prompt into your favorite AI tool:
Suggested AI Prompt: “You are a corporate finance analyst preparing an executive recommendation. Please calculate the 3-year historical ROIC, incremental ROIC (ROIIC), and Return on Equity (ROE) for [Insert Company A] and [Insert Company B] using their latest 10-K filings from Yahoo Finance or SEC.gov. Provide a step-by-step breakdown of NOPAT, Average Invested Capital, and total shareholder equity, and explain whether new growth capital is creating or diluting economic value relative to their cost of capital.”
© Katherine Dextraze, F Avenue Consulting, 2026
yes! 👏