

When you are first starting to analyze financial statements, it’s easy to focus almost entirely on the just the Income Statement. The concepts of revenue, profit, and earnings per share can feel more familiar and easier to grasp. But the Balance Sheet is where the strategic story really lives - showing how the business raises and invests its capital. While the Income Statement records past operational performance over a single period, the Balance Sheet reveals a company’s cumulative strategic choices, financial risk, and capacity for future growth
How the Balance Sheet got its name
A simple way to understand the mechanics of the Balance Sheet is to use the example of owning a home. Suppose you buy a home valued at $500,000. You put 20% down and pay the rest using a mortgage loan.
Your home’s balance sheet looks like this:
Asset ($500,000): The physical house—something of value that you control.
Liability ($400,000): The mortgage loan you secured from the bank to finance the purchase.
Equity ($100,000): The cash down payment you provided out of your own pocket.
Assets ($500,000) = Liabilities ($400,000) + Equity ($100,000)
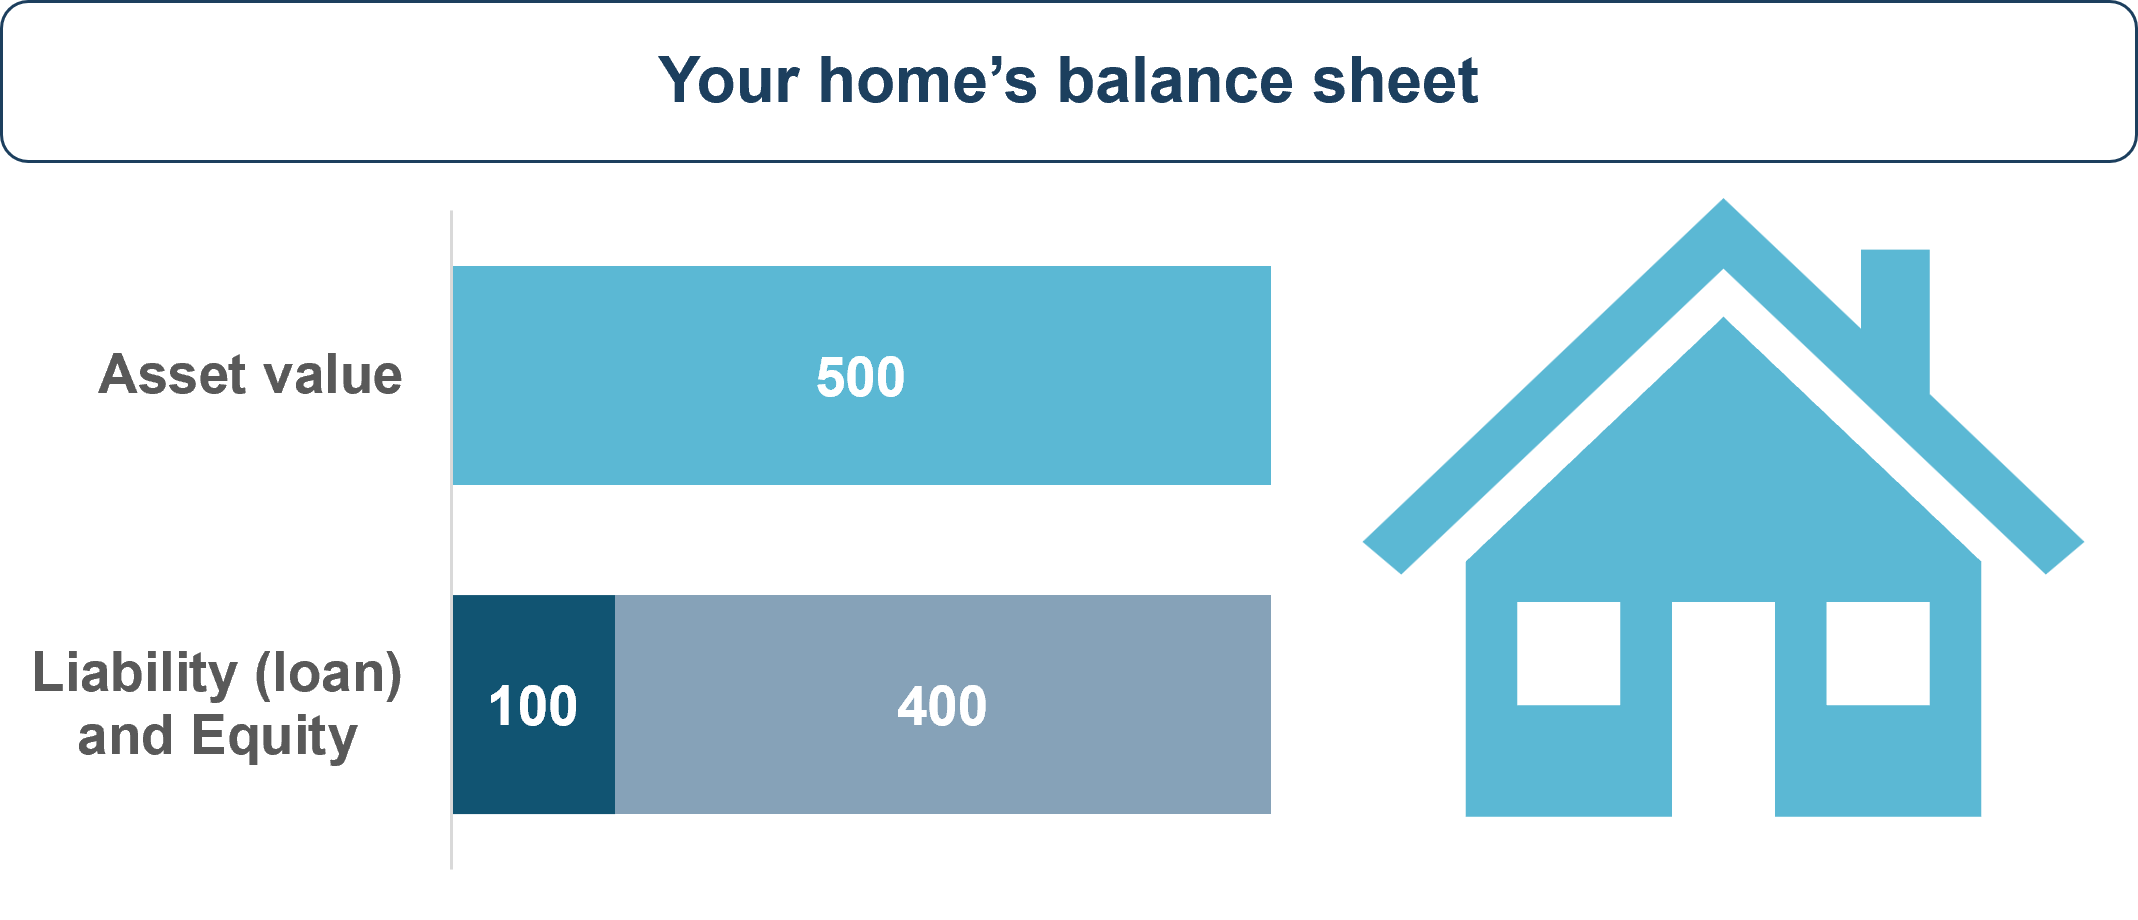
The Balance Sheet reports the assets, liabilities, and equity of the business at a point in time and the value of the assets will always equal the total value of the liabilities and equity, so the Balance Sheet always balances. This is because every asset a company owns has to be paid for somehow. There are only two ways a business can pay for an asset:
Borrowing money from external creditors (creating a Liability, such as debt or trade payables).
Using capital from owners, meaning cash that was injected directly by shareholders or cash generated from cumulative past profits retained in the business (creating Equity).
Because every dollar of assets is claimed by either a creditor or an owner, Assets must always equal Liabilities + Equity.
Key Components of the Balance Sheet
Let’s take a look at corporate balance sheet. On a standard GAAP Balance Sheet, Assets and Liabilities are ordered by liquidity (how quickly they convert into cash) and classified into two primary time horizons:
Current (Short-Term): Expected to convert into cash, be consumed, or be settled within 12 months.
Long-Term (Non-Current): Obligations or commitments extending beyond 12 months.
This timing distinction is critical to understanding the different between a company’s long-term strategic investments versus the day-to-day operational engine funded by working capital.
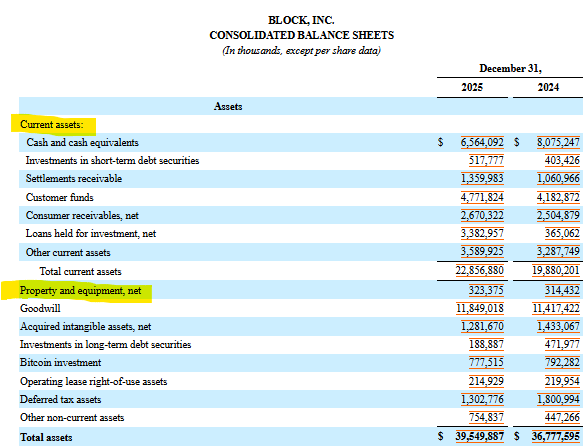
Looking at the assets of Block, Inc., we see that “Current assets” are specifically categorized on the balance sheet and include cash and cash equivalents, receivables from settlement and customers, customer funds, and more. The long-term assets start with Property and equipment (also called PP&E), then goodwill and acquired intangible assets that come from buying other businesses, and other long-term investments specific to Block’s business model.
You might notice that in the “Current assets” section, Block lists “loans held for investment,” and maybe that feels a bit odd since we would typically see a loan listed in liabilities, right? This is where the unique aspects of Block’s business model show up - these specific loans are short-term loans that Block has offered to their users through Cash App Borrow and Square. So, Block expects to be repaid from their users and they list that future repayment as current asset.
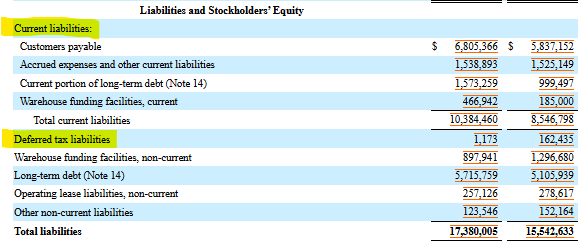
Now, let’s take a look at the liabilities of Block, Inc. We see that the liabilities also start with “Current liabilities” and include customers payable (customers that have requested payout and are waiting for Block to process it), accrued expenses and other such as payroll or rent that is coming due, current portion of long-term debt meaning any part of a long-term loan use for general corporate borrowing that needs to paid, and warehouse funding facilities, current that Block uses to back their loans to consumers. The long-term liabilities start with Deferred tax liabilities, then long-term portions of the warehouse funding facilities and long-term debt that come from buying other businesses, and other long-term liabilities specific to Block’s business model.
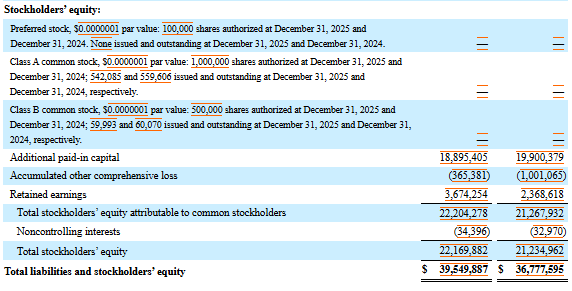
To finish out the balance sheet, let’s look at the stockholders equity section. The first thing you can check is whether the total liabilities & stockholders’ equity matches the total assets. Then, let’s look at the line items - we several types of equity that have not been issued yet and have a zero value, then additional paid in capital which tracks the money that investors originally paid for the shares that are currently outstanding, accumulated other comprehensive loss from unrealized losses (market price shift) on the marketable debt securities that they hold, and retained earnings which tracks the cumulative net income generated by the business. Retained earnings and net income are the key links between the balance sheet and the income statement.
You will also notice that Block has multiple types of equity listed - preferred stock, Class A common stock, and Class B common stock. Block’s leadership and board of directors has to approve any new shares that the company wants to issue, so you can see that each of these types of equity say “authorized” for a certain number of shares - but none of those shares have been issued yet. More to come on the different types of stock.
The Strategic Pillars of the Balance Sheet
Running a business revolves around two primary decisions: how to raise capital and how to invest capital. Through analyzing the Balance Sheet, we can start to see how the company’s leadership executes across three critical strategic pillars: capital allocation, capital structure, and operational execution.
Capital Allocation: Where Management Bets Its Future
The P&L shows what a company earned this quarter, but the Asset side of the Balance Sheet reveals where leadership has chosen to deploy long-term resources. Is the company reinvesting in organic expansion (PP&E and R&D infrastructure), buying market share through acquisitions (recorded as Goodwill and Intangibles), or hoarding cash for optionality?
Capital Structure & Strategic Flexibility: How Bets Are Funded
How a business is funded will directly impact the leadership’s ability to execute on the corporate strategy. The Liabilities & Equity side exposes a company’s leverage and financial durability. A balance sheet with lots of long-term debt will show high fixed interest expenses on the Income Statement, so cash is tied up in paying the debt and will limit leadership’s ability to execute on ambitious growth strategies or strategic pivots during downturns. On the other hand, a clean balance sheet with low debt (also called “leverage”) and sufficient cash can provide the "dry powder" needed to execute opportunistic M&A or survive macro shocks.
Operational Execution & Working Capital Velocity
As a business grows, cash can get trapped in operational holding areas: Accounts Receivable (A/R) from customers who still need to pay their invoices and Inventory sitting on shelves. This ‘trapped’ cash can be offset by Accounts Payable (A/P), where the business can try to hold on to cash longer by extending the number of days it has to pay its suppliers. A growth strategy can look great on a P&L, but operational execution happens on the Balance Sheet through Net Working Capital (NWC):
NWC = Current Assets (AR & Inventory) − Current Liabilities (AP)
Net Working Capital is a critical component to understanding how much cash the business is generating to pay its bills. For instance, if the AR balance is increasing, it tells us that customers are taking longer to pay their bills and we may need to ask our suppliers for longer payment terms. This brings us to the next core operational concept - the Cash Conversion Cycle. The cash conversion cycle tracks how how many days it takes to turn cash the business spent on inventory into cash collected from sales. There are three key metrics that drive the cash conversion cycle:
Days Sales Outstanding (DSO): How quickly customers pay their credit bills.
Days Inventory Outstanding (DIO): How long inventory sits before selling.
Days Payable Outstanding (DPO): How long the company takes to pay its trade suppliers.
Executive Real-World Anecdote: The Working Capital Trap
When I was in renewable energy, I saw solar install businesses grow their sales rapidly, sometimes 2-3x in a short period of time. Each install required purchasing expensive inventory (panels, inverters, batteries) that was subject to changing tariffs and paying installation labor sometimes weeks before receiving the final payments from customers. If customers were unhappy or facing issues with their new solar, the might even refuse to pay all together. From a P&L perspective, these businesses showed strong revenue growth and profitability. But on the balance sheet, AR from customers was increasing rapidly, trapping much needed cash.
Managing the Balance Sheet is the critical difference between scaling a business sustainably and running out of cash during a growth spurt.
Suggested Exercise: AI Finance Lab
Exercise: Open a notebook with your preferred model and upload the recent 10-K filings for Block, Inc. (SQ) or another company that you’re interested in. Use the following prompt to start a conversation about the company’s balance sheet:
"You are a corporate finance director interested in the liquidity and cash performance of the business. Analyze the Consolidated Balance Sheets and Statements of Cash Flows in this filing. Extract Current Assets (including A/R and Inventory) and Current Liabilities (A/P) for the last two fiscal years. Calculate the change in Net Working Capital and summarize management's disclosures in Item 7 (MD&A) regarding working capital liquidity and cash collection performance."
© Katherine Dextraze, F Avenue Consulting, 2026