

In the world of investing, most transactions feel like exhausting modern dating. You spend weeks researching a company, nervously decide when to buy, constantly monitor quarterly earnings to see if you should break up and sell, and then stress over where to take your capital next. Every round-trip trade introduces friction, capital gains taxes, and the ever-present risk of terrible market timing.
Charlie Munger famously hated that constant churn. He preferred a much simpler romantic arrangement: the one-decision investment.

A compounder is the ultimate “forever stock.” You do not trade it, you do not swap it out for a younger, flashier growth story next quarter, and you certainly do not panic sell it during a market wobble. You buy shares in an extraordinary business, put a ring on it, and let the company’s internal wealth-creation engine do the heavy lifting for decades while you sit back and enjoy the relationship.
Of course, before you commit to holding a company for the rest of forever, that business has to show truly exceptional character. To avoid getting stuck in a toxic value trap, an investor needs to look for four core pillars that define a compounding machine:
High Return on Invested Capital (ROIC) and Incremental ROIC (ROIIC): The business earns high returns on existing capital and deploys new capital at equal or better rates.
A Sustainable Competitive Moat: Deep structural advantages anchored in customer captivity that keep competitors at bay.
A Large Total Addressable Market (TAM): A long, open runway to reinvest retained cash at high returns.
A Dedicated, Value-Focused Management Team: Leadership that acts like genuine long-term owners rather than short-term mercenaries chasing quarterly option grants.
So, we’ve got the concepts, let’s talk about how to find measurable data points that we can use to screen thousands of public stocks and find “the one”.
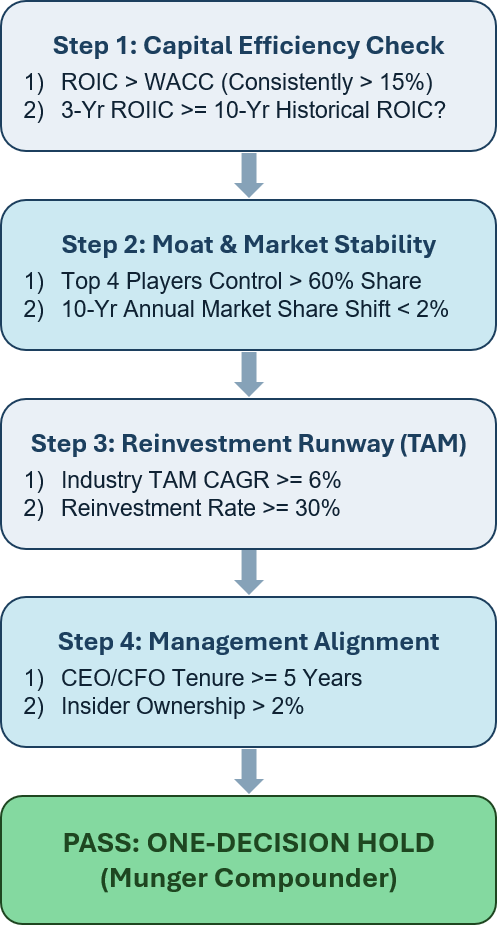
1. Financial Returns: ROIC and Incremental ROIC (ROIIC)
Calculating baseline Return on Invested Capital (ROIC) and Incremental ROIC (ROIIC) gives you an immediate picture of capital efficiency.
ROIC: Measures how efficiently a company converts total capital into Net Operating Profit After Tax (NOPAT). A strong baseline threshold is an ROIC consistently above 15% (and well clear of the company’s cost of capital).
Incremental ROIC (ROIIC): Measures the return earned strictly on new capital retained and reinvested over a 3-year window.
When a company’s 3-year ROIIC meets or exceeds its historical average ROIC, every fresh dollar retained expands its underlying earnings power value rather than diluting returns.
The Measurable Filter: Filter for historical ROIC above 15% where 3-year ROIIC is equal to or greater than the 10-year historical average ROIC.
2. Competitive Moat: Market Share Concentration and Stability
A true moat relies on structural barriers such as deep customer captivity, high switching costs, or massive scale. While “customer loyalty” sounds fuzzy, true captivity leaves clear footprints in industry data.
Market Share Concentration: Moats thrive in consolidated industries where four or fewer dominant players control the market.
Market Share Stability: In a protected industry, market share numbers stay remarkably stable over 5-year and 10-year windows, showing zero chaotic annual market share churn.
The Measurable Filter: Filter for companies holding top-two market share in an industry where the top four players control over 60% of the market, and historical annual market share shift has varied by less than 2% year-over-year over the past decade.
3. Runway for Growth: Industry TAM and Reinvestment Opportunity
A high ROIC alone makes a great cash cow, but without a long runway to reinvest cash, the company cannot compound.
Industry Macro Growth: The broader industry must benefit from secular tailwinds so the company expands without fighting bloody market share wars.
Reinvestment Rate: The company must actively retain and deploy a significant chunk of earnings back into organic expansion or accretive projects.
The Measurable Filter: Filter for companies operating in industries with a projected macro CAGR of 6%+, paired with a reinvestment rate (CapEx + R&D minus depreciation over NOPAT) of at least 30%.
4. Management Discipline: Executive Tenure and Capital Allocation
Charlie Munger noted that the best managers never sacrifice long-term operational health for short-term quarterly optical gains. Evaluating management requires checking for tenure and direct skin in the game.
Executive Tenure: Long-tenured CEOs and CFOs develop deep operational familiarity with their moat and corporate culture.
Turnover and Alignment: High executive turnover signals strategy shifts or board friction, whereas stable leadership protects the long-term compounding engine.
The Measurable Filter: Filter for executive teams (CEO/CFO) with at least 5 years of tenure in their current roles, insider stock ownership above 2% of outstanding shares, and executive compensation tied directly to long-term ROIC or capital efficiency metrics.
Real-World Case Studies: Passing and Failing the Test
Let’s test this framework against three well-known public companies to see who earns a long-term commitment and who gets left at the altar.
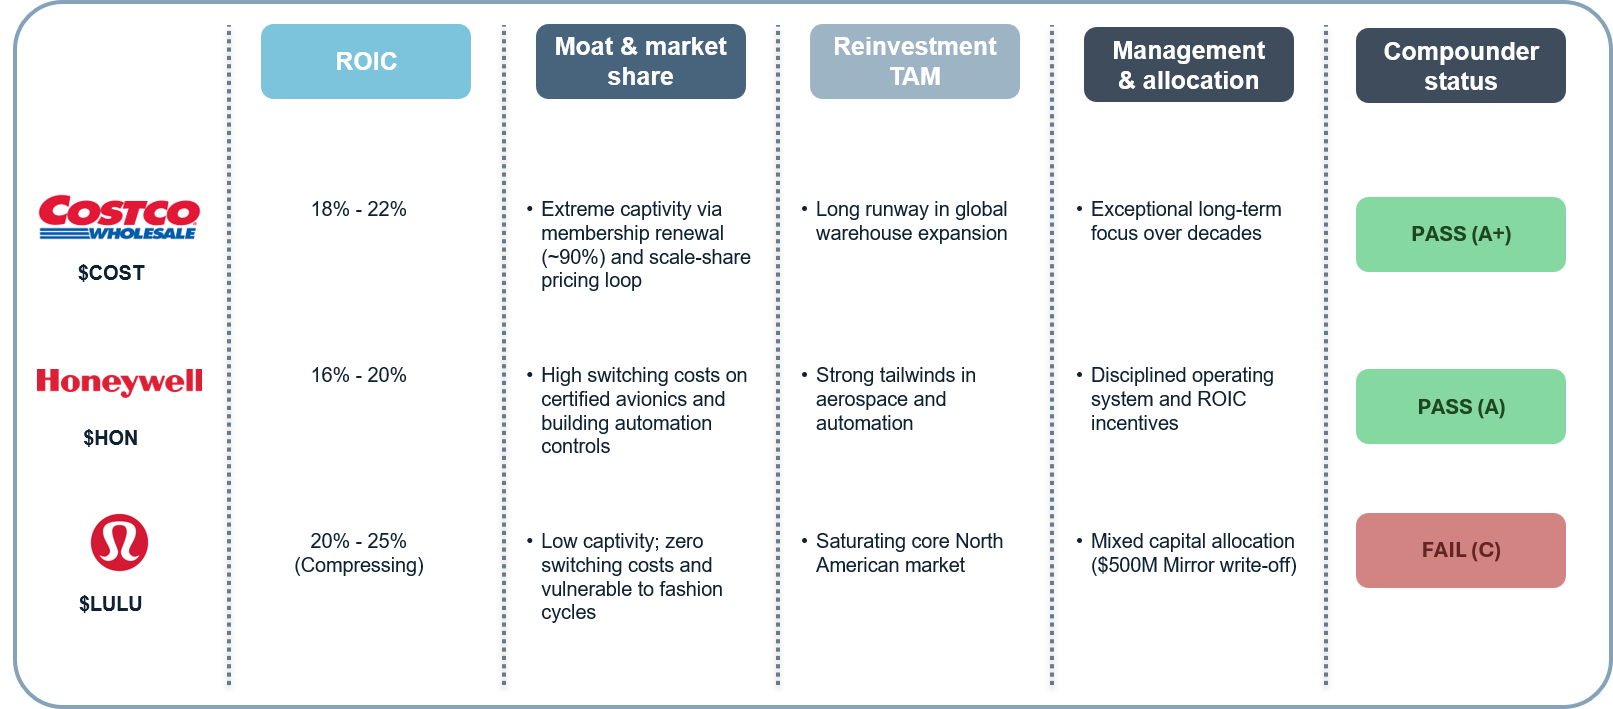
1. Costco Wholesale COST 0.00%↑ : The Benchmark Forever Stock
Verdict: PASS (Grade: A+)
Charlie Munger served on Costco’s board of directors for 25 years and famously called it his favorite business. Running it through our four metrics shows why it remains the gold standard of a “put a ring on it” stock:
1. Financial Returns: Costco generates an ROIC between 18% and 22%, well clear of its ~8% WACC. Because it expands using an asset-light subscription model where membership fees cover operating overhead, its 3-year ROIIC equals or exceeds its historical ROIC.
2. Moat & Customer Captivity: Costco’s moat relies on extreme customer captivity. Its membership renewal rate is ~90% globally (92%+ in North America), creating highly predictable subscription cash flows. Munger pointed out that Costco’s “scale-share” model—passing bulk purchasing savings directly back to the customer rather than gouging on retail margins—creates an economic bond that competitors cannot break.
3. Reinvestment Runway: Despite its massive size, Costco still has a long runway. It remains underpenetrated internationally (expanding across Europe, Asia, and Latin America) and continues to add 20 to 30 new warehouses per year at high incremental returns.
4. Management Alignment: Munger noted that over his 25 years on the board, CEO Jim Sinegal and his successors never made a single decision that sacrificed long-term health for a short-term quarterly gain. Munger famously remarked that Sinegal “would no sooner raise prices inappropriately than he would steal from a widow”.
2. Honeywell International HON 0.00%↑: The Industrial Tech Compounder
Verdict: PASS (Grade: A)
Honeywell demonstrates how high switching costs and mission-critical technology create a durable compounder outside consumer retail.
1. Financial Returns: Honeywell maintains a baseline ROIC of 16% to 20%, outperforming traditional industrial peers. Its 3-year ROIIC has expanded as management shifted capital toward high-margin software (Honeywell Forge), building automation, and aerospace avionics.
2. Moat & Customer Captivity: Honeywell’s avionics, auxiliary power units, and industrial control systems are embedded into commercial aircraft and major infrastructure. Once a Honeywell flight control system is certified on an aircraft platform, replacing it requires millions of dollars in regulatory recertification and operational downtime. The switching costs are astronomical (pun intended).
3. Reinvestment Runway: Honeywell operates in markets with multi-decade secular tailwinds: commercial aerospace expansion, industrial automation, and building energy efficiency (a global TAM growing at 6% to 8% annually).
4. Management Alignment: Honeywell maintains a culture of long executive tenure and utilizes the “Honeywell Operating System” (HOS) to drive capital discipline, with executive compensation explicitly tied to ROIC and free cash flow conversion.
3. Lululemon Athletica LULU 0.00%↑: The Fashion Trap
Verdict: FAIL (Grade: C - High Quality Business, but NOT a Munger Compounder)
At first glance, Lululemon looks attractive due to high profit margins and impressive historical sales growth. However, putting it through the 4-pillar screener exposes why it fails the “forever hold” test:
1. Financial Returns: While historical ROIC was exceptionally high during the rise of athleisure, its 3-year ROIIC is volatile and compressing. As the brand scales, each incremental dollar spent on store footprint, marketing, and inventory yields lower incremental operating profit.
2. Moat & Customer Captivity (THE FATAL FLAW): Zero structural customer captivity. Unlike Costco’s membership lock-in or Honeywell’s certified flight hardware, consumer apparel carries zero switching costs. Lululemon built a powerful brand, but apparel remains bound to fashion cycles and brutal competition. Customers can easily switch to Alo Yoga, Vuori, Nike, or private-label alternatives without financial friction.
3. Reinvestment Runway: Core North American women’s leggings markets are approaching saturation. To grow, Lululemon is forced to push into tougher, lower-margin adjacent markets (men’s apparel, footwear, international expansion) where brand equity is less dominant.
4. Management & Capital Allocation Blunders: Lululemon fails the capital allocation discipline test. The company has experienced significant executive turnover across its history and executed a classic capital allocation mistake: buying home-fitness startup Mirror for $500 million in 2020, only to write off virtually the entire investment a few years later as the business stalled.
Practical Application: The AI Compounder Screener Prompt
Try it on your own! Copy the AI prompt below into your research workflow to evaluate candidate stocks against the 4-pillar criteria:
You are a senior equity research analyst specializing in long-term compounders and fundamental quality investing.

Analyze [Insert Company Name / Ticker] against the four core criteria of a one-decision compounder. Provide a structured evaluation using specific financial figures:

1. Return Metrics (ROIC & ROIIC):
   - Calculate 10-year historical average ROIC vs. current WACC.
   - Calculate the 3-year Incremental ROIC (ROIIC). Is fresh capital being deployed at returns equal to or higher than historical averages?

2. Moat & Market Share Stability:
   - Identify the company's primary competitive advantage (customer captivity, scale, or proprietary process).
   - What is the market share breakdown among the top 4 industry players, and how stable has market share been over the past 5 to 10 years?

3. Reinvestment Runway & TAM:
   - What is the estimated CAGR for the broader industry over the next 5-10 years?
   - What percentage of operating cash flow is being reinvested back into organic R&D and CapEx?

4. Management Alignment & Stability:
   - What is the tenure of the CEO and CFO?
   - What percentage of shares is owned by insiders, and is executive compensation tied directly to long-term ROIC or capital efficiency metrics?

Conclude with a final assessment score (Pass / Neutral / Fail) on whether this company fits the definition of a long-duration compounder.
Excellent article, thank you!
The best real-world analogy I have read on the compounding magic of concentrated, long-term stock investing.